- Home
- About
- Advantages of JPods
- Capacity
- Conservation
- Economics
- 10X Capital Savings
- Base the $ on Energy
- Dangerous Economic Assumptions
- Free Markets
- Jobs
- Land Use
- Linear Barriers to Commerce and Nature
- Metrics: Replace GDP with Disposable Energy
- Parking
- Supply_Demand
- Free Market Efficiency
- Net Energy Decline
- Inaccurate IEA Forecasts
- 'Titanic' Oil Economy
- Paychecks and Oil
- History
- Lifeboat Paradox
- Links
- Management Team
- Metrics
- Payback
- Peak Oil
- Project Flow
- Recipe
- Solar
- Technologies
- What are JPods
- Why JPods®
- Be Involved
- Key Steps
- Franchise Agreement (draft)
- Solar Mobility Act
- Own and Operate a JPods Network
- Become a JPods Supplier
- Design Your Own JPods Network
- Investors
- Spread The Word
- 8-80 Cities
- Agreements
- Cities of the Sun
- Domestic War by 2023
- Kitty Hawk Network
- Regulation
- San Jose State
- Scale Model
- Railroad 1862
- News
- Cities
- Contacts
You are here
Payback
Traffic from moving 2 tons to move a person forces Americans to pay about $2.23 trillion per year. 16% of our income ($813/monrh) is spent on transportation. Cars are parked 95% of the time.
- $756 billion per year for oil.
- $340 billion to $871 billion per year in accidents, alternate data source.
- 40,100 road-deaths in 2017.
- 2.31 million injuries in 2013.
- $305 billion per year in congestion.
- $109 billion per year in car damage from poor road maintenance.
- $723 billion per year in land use at $1 per square foot per year (cost of a garden plot, apartments are normally $2-5 square foot per month with multiple floors in a single square foot of land).
About $1 trillion per year of costs can be recovered as value (customer savings and profitable revenue). Link to PowerPoint and KeyNote presentation. There is over a $trillion per of waste that can be converted to profits and customer savings by repeating in transportation the success of restoring communication infrastructure to free markets in 1982.
To accomplish this cost to value change will requires about 500,000 miles of JPods, Hyperloop, ET3 and other networks. This is about 4 times the amount of freight railroads (140,000 miles) and 1/4th the lane miles of urban roads (nearly 2 million). At $10 million per mile, the cost of this retooling is about $5 trillion. The effort will pay for itself about every 5 years. H
This 5 years payback is consistent with the 2010 audit of the Morgantown PRT network and Kiva systems conversion of a $33 million investment into a $775 million sale to Amazon.
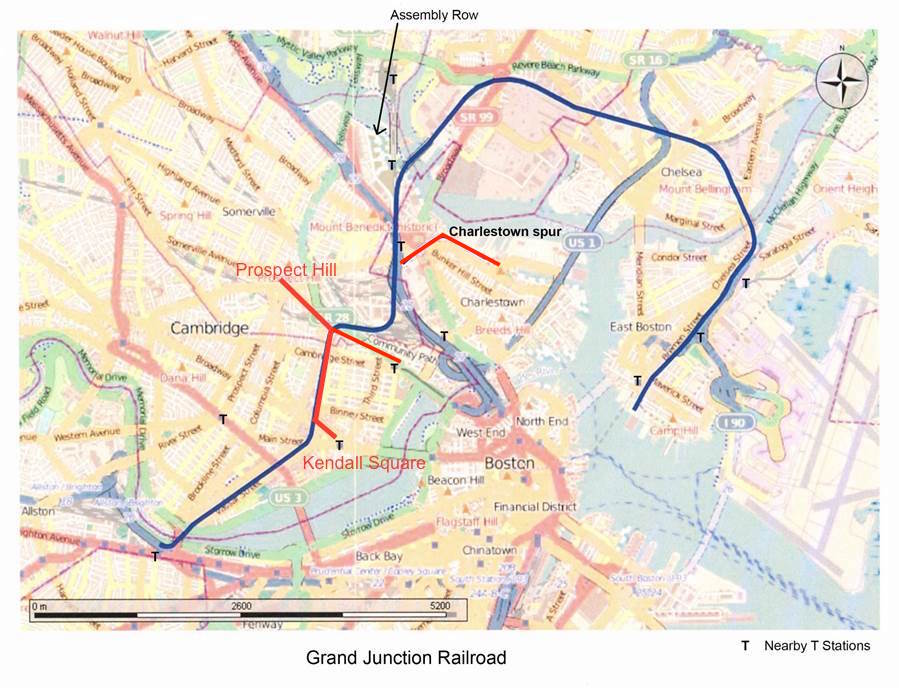
The Grand Junction Line Links:
- MassDOT study of Grand Juction Line
- Hearing with Boston City Council
- Saudi Arabia "Post-oil Era" Fund
- $100 Trillion shift from "Just-in-Time" to "Just-in-Case"
- Example P&L and Balance Sheet
- Depleting US oil resources.
- Metrics
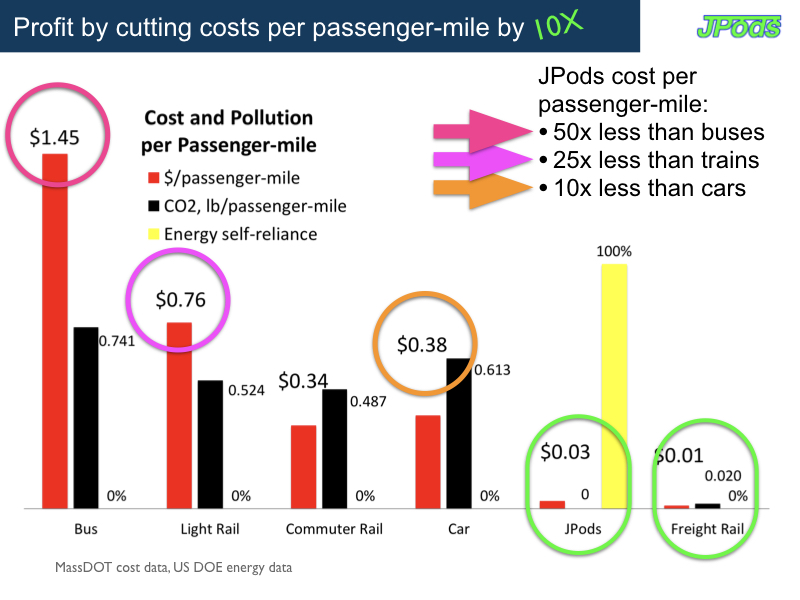
There are several ways to look at paybacks from cost per passenger-mile to safety to capacity to time savings. As a quick summary here is a graph of costs per passenger-mile based on MassDOT data:
Contract signed on 2018-01-17 to build the world's first solar-powered mobility network by Dec 2018.
Aside from the China contract and price 3 cents per passenger-mile, JPods packet-switched networks are faster, safer, cleaner, and more affordable. JPods builds on:
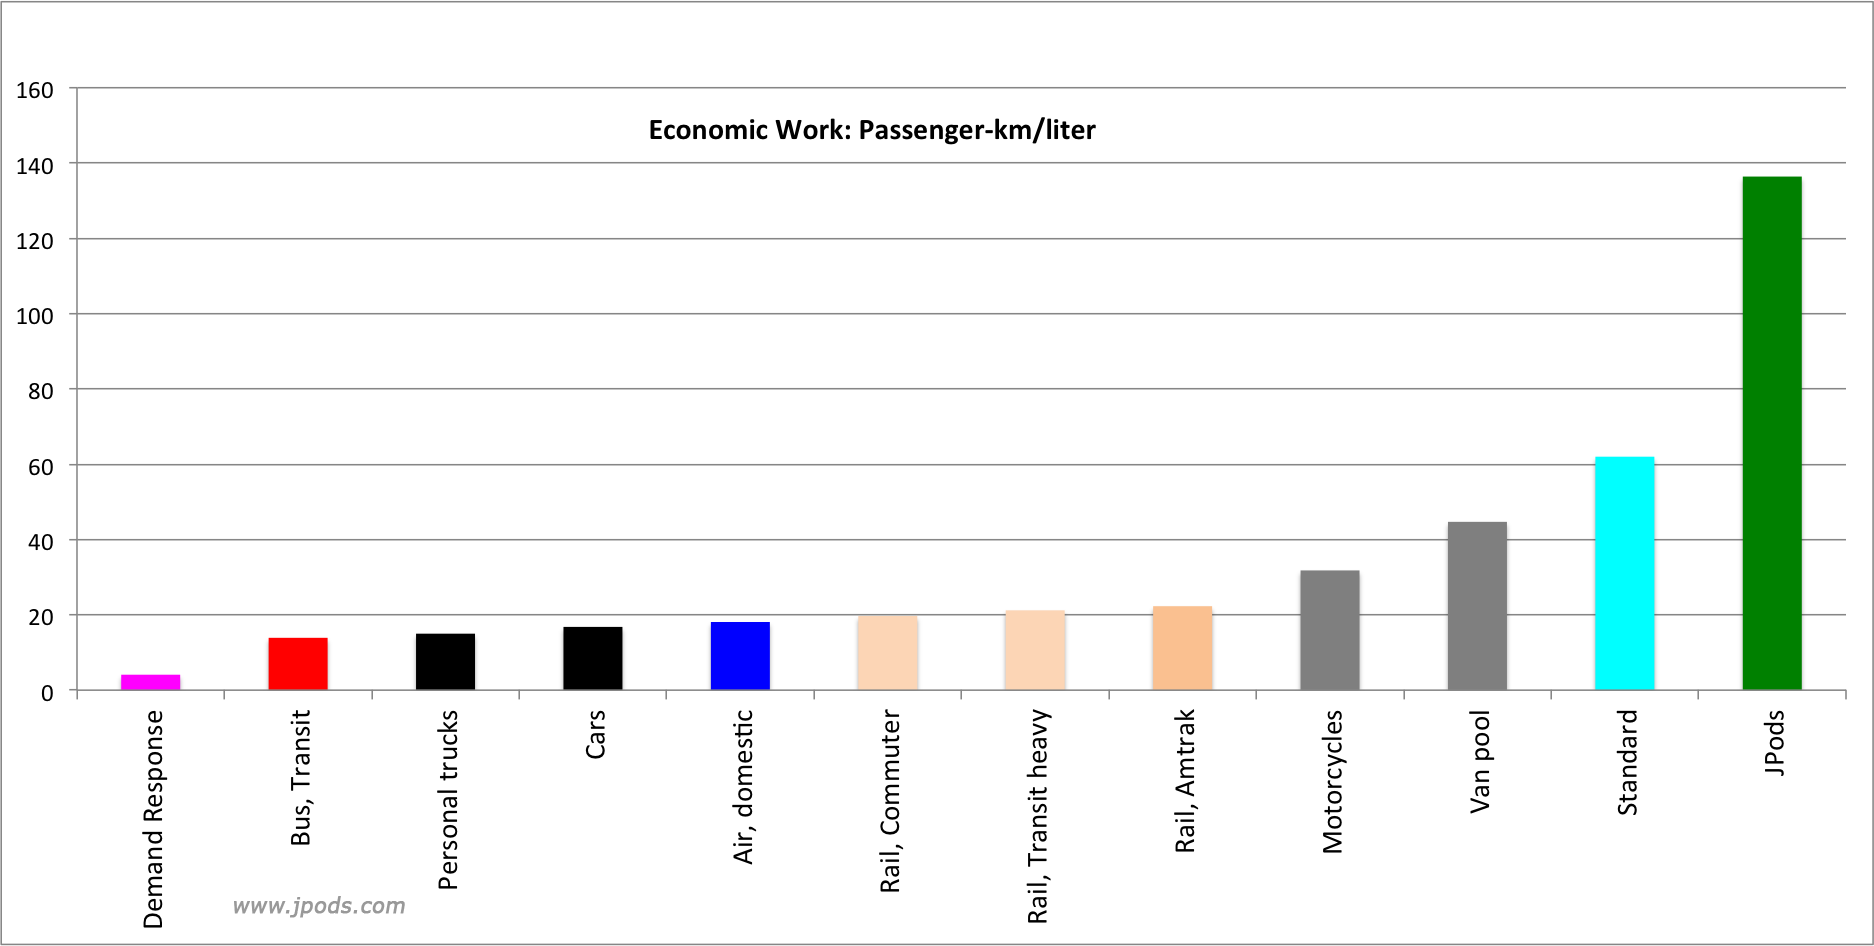
- The efficiency of freight railroads (476 ton-miles per gallon).
- The zero-injury since 1975 safety record of Morgantown's Personal Rapid Transit (PRT) network.
- The on-demand service of the Internet, by building the Physical Internet®.
passenger-mile cost
Passenger-mpg
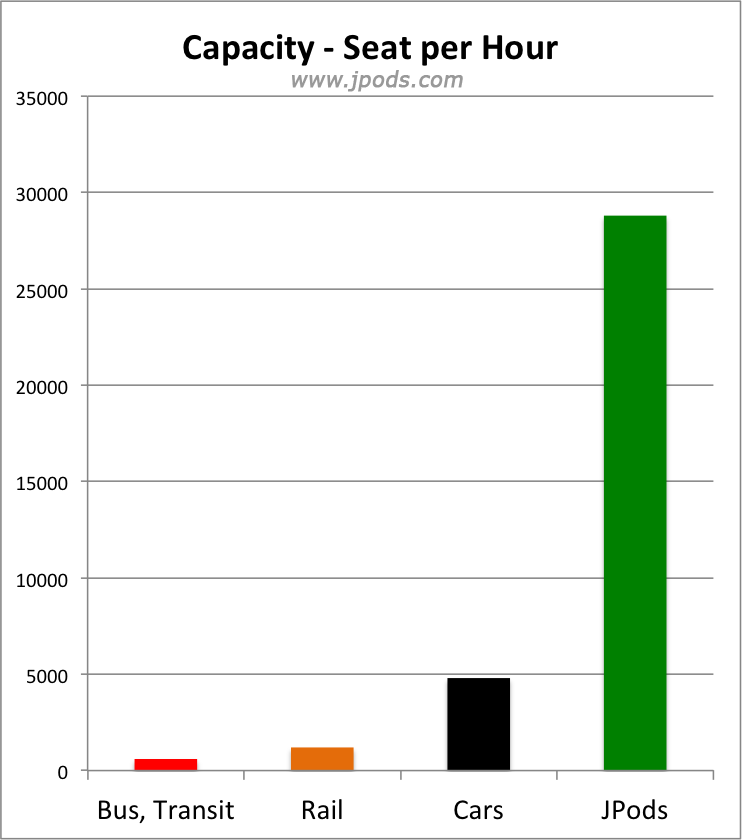
Seats/hour/lane
Headway
Speed mph
Mode-Deaths/Year
JPods/PRT
$0.03
264.4
28,800
.5 sec
30
zero since 1975
Light Rail
$0.76
38.2
1200
10 min
24
743
Cars
$0.38
32.6
4800
3 sec
18
34,624
Buses
$1.45
27
600
5 min
8 to 12
44.2
- Traffic costs the people of Massachusetts about $15.7 billion per year. About $9 billion per year can be earned as value and customer savings:
- Fuel: $6.7 billion
- Accidents: $6 billion
- Congestion: $3 billion
- Videos and Presentations:
- China
- India
- Presentation to Boston City Council
- Presenation to NJ DOT.
- Duke University Presentation
- TEDx Atlanta
- Background of flood control and disaster relief. Talking Points with the Deputy Commanding General, US Army Corps of Engineers.
- Garden Girls Presentation to Fremont, CA City Council
- Performance Standard Law is required to raise capital and Franchise Ordinance. Legal barriers to self-driving cars are being removed. We need to remove the barriers to cleaner, faster, safer, and more affordable mobility networks. Kiva systems is applying the concepts in warehouses. Current DOT policies caused the loss of 120,000 miles of freight railroads despite efficiencies of 476 ton-miles per gallon.
- Build with private capital.
- Operate without government subsidies.
- Exceed 5x the efficiency of highways.
- Exceed the safety of highways.
- Pay 5% of gross revenues to the Rights of Way holders.
- Regulate by the ASTM F24 Theme park standards:
- Existing written enforcement and industry.
- Existing insurance industry.
- Existing common law.
- Safety record thousands of times better than DOTs with a specific focus on safety of pedestrians, especially children.
- Build on the success of the Morgantown PRT network and the independent audit showing a payback every 5 years. Morgantown's PRT is self-regulated, so it does not provide a repeatable model for deploying new networks.
- Kitty Hawk Networks are starter networks to train crews and localize manufacturing. JPods can build Kitty Hawk Networks in the US and ship them to China and India, or put factories in China and India to ship to the US. Print Quality Kitty Hawk and Email Quality Kitty Hawk.
- How stations work.
- Capacity of the networks are 20 times that of light rail. No one waits more than two minutes, even when there is a sudden large group, such as a train unloading.
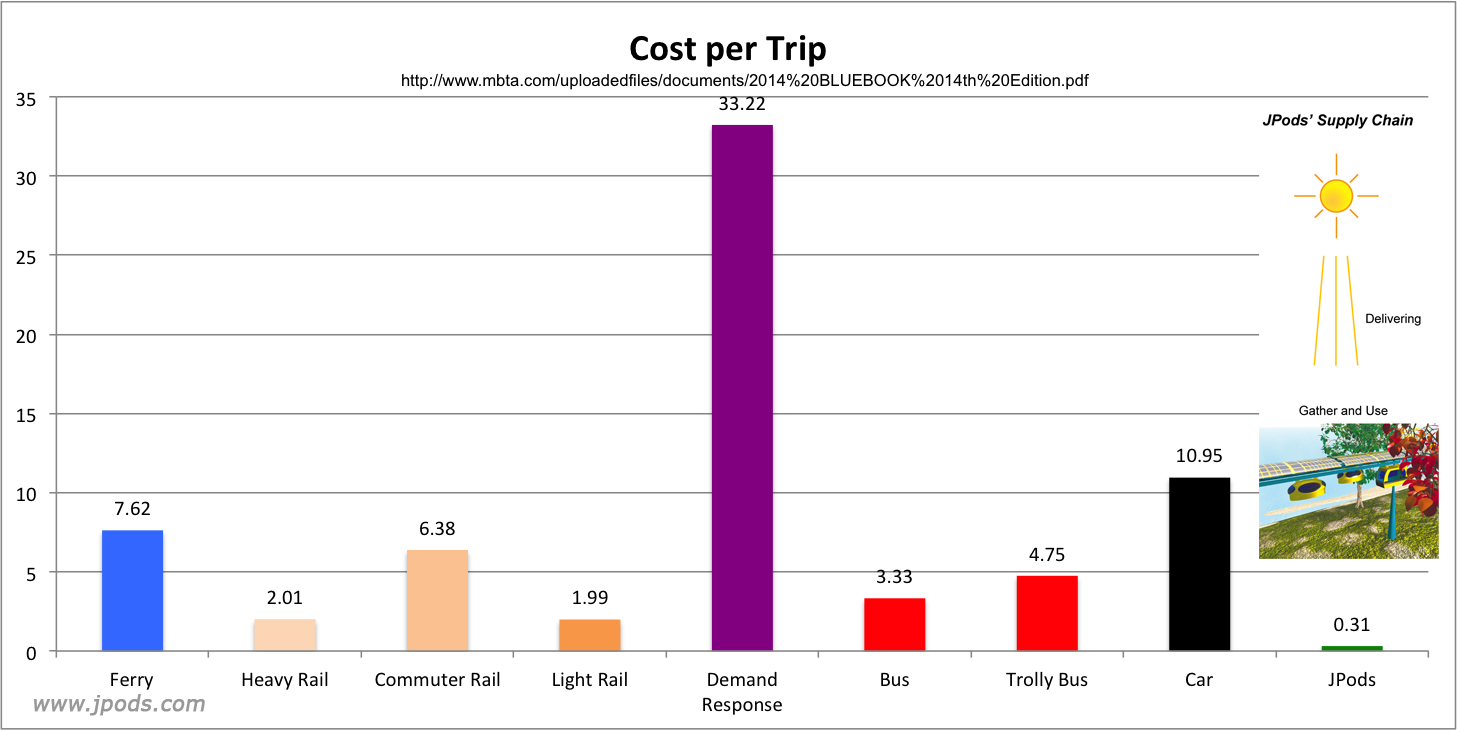
- Costs of the networks are 1/10th the cost of light rail.
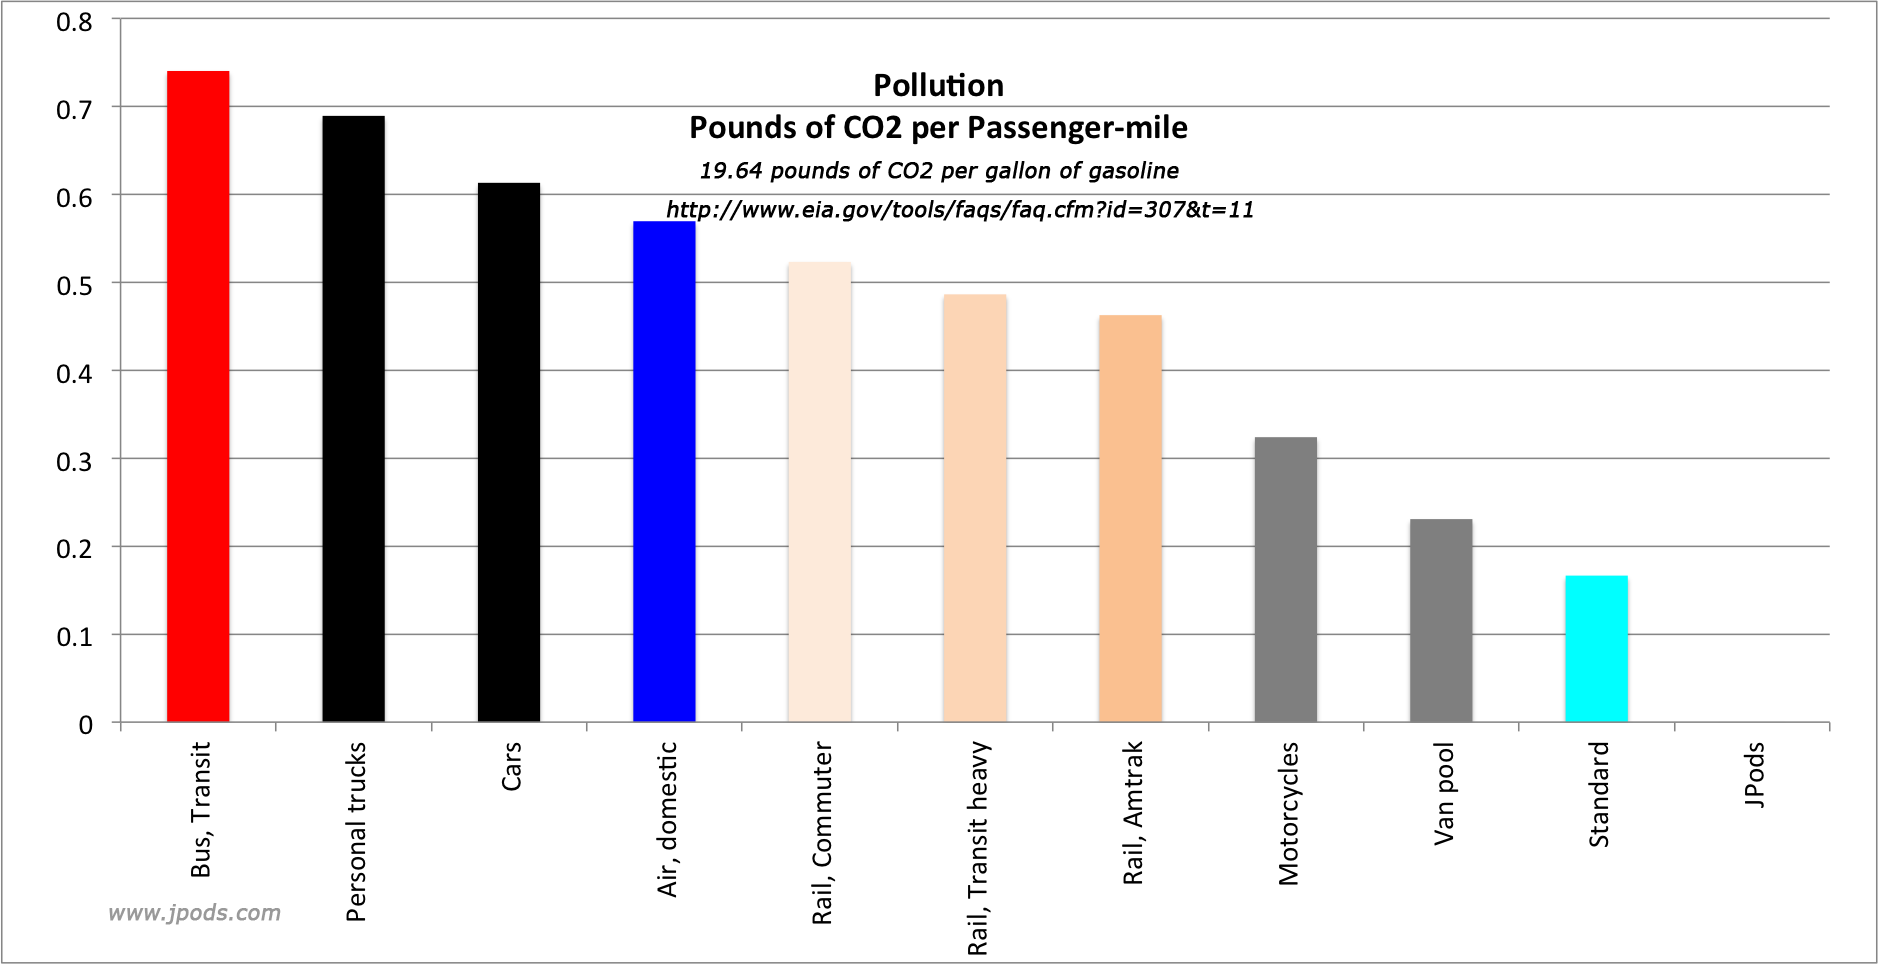
- Energy savings, converting current costs of 59.2 cents per mile to operate a car into 55.2 cents per mile of profits and customer savings. JPods cost 4 cents per vehicle-mile to operate. Profit is the difference between the value customers willingly pay minus the cost to compete. JPods increases the value by solving congestion and reduces costs by solving pollution. JPods converts costs to value by removing the Parasitic Mass of the vehicle and the energy costs of repetitive start-stops in traffic (Parasitic Energy Ratio).
- Prime Law of Networks. JPods provides dense network conductivity in highly repetitive urban transport of people and cargo. ET3 provides high-speed connections between communities.
- Paper illustrating emptying a stadium.
- Life requires energy. Cheap oil is finite. Life powered by cheap oil is terminal. Article on Peak Fracking is slowly accumulating 1.4 times the harm of the 1973 Oil Embargo.
Specifics on Grand Junction route and needs:
Length of Networks: 20 km or 12.5 miles
Network Cost: $200 million
Construction Period: 14 months
Need is indicated by the Prime Law of Networks and the cross connecting (clockwise) of the Green, Red, Green, Orange, and Blue Lines. With an average fare of $3 and 25% of the loads of existing networks, the networks pay for themselves every 7 years. This compares favorably with the Independent Audit of the Morgantown PRT network.
| weekly | cross traffic | average fare | fare box | yearly | |
| Red Line | 272,684 | 25% | 3 | 204,513 | 10,634,676 |
| Orange Line | 203,406 | 25% | 3 | 152,555 | 7,932,834 |
| Blue Line | 63,225 | 25% | 3 | 47,419 | 2,465,775 |
| Green Line | 227,645 | 25% | 3 | 170,734 | 8,878,155 |
| 29,911,440 |
- Bikes: https://usa.streetsblog.org/2020/10/10/exactly-how-far-u-s-street-safety...
- University of Michigan, Personal Transportation Factsheet, https://css.umich.edu/publications/factsheets/mobility/personal-transpor...
Theme by Danetsoft and Danang Probo Sayekti inspired by Maksimer